Jon Krohn: 00:00:00
This is episode number 715 with multi-time bestselling author Dr. Allen Downey. Today’s episode is brought to you by the Zerve data-science dev environment, by Modelbit, for deploying models in seconds, and by Grafbase, the unified data layer.
00:00:19
Welcome to the Super Data Science podcast, the most listened-to podcast in the data-science industry. Each week we bring you inspiring people and ideas to help you build a successful career in data science. I’m your host, Jon Krohn. Thanks for joining me today, and now let’s make the complex simple.
00:00:50
Welcome back to the Super Data Science podcast. It’s my great honor and delight to have the incredible Dr. Allen Downey as our guest on the show today. Allen is a professor emeritus at Olin College and curriculum designer at the learning platform Brilliant. He was previously a visiting professor of computer science at Harvard and a visiting scientist at Google. He’s written 18 books, all of which have been made available for free at greenteapress.com. Check them out, but his books are also typically published in hard copy by major publishers. For example, his books Think Python and Think Bayes were bestsellers published by O’Reilly. His next book, Probably Overthinking It, will be out in December and is available for pre-order now.
00:01:32
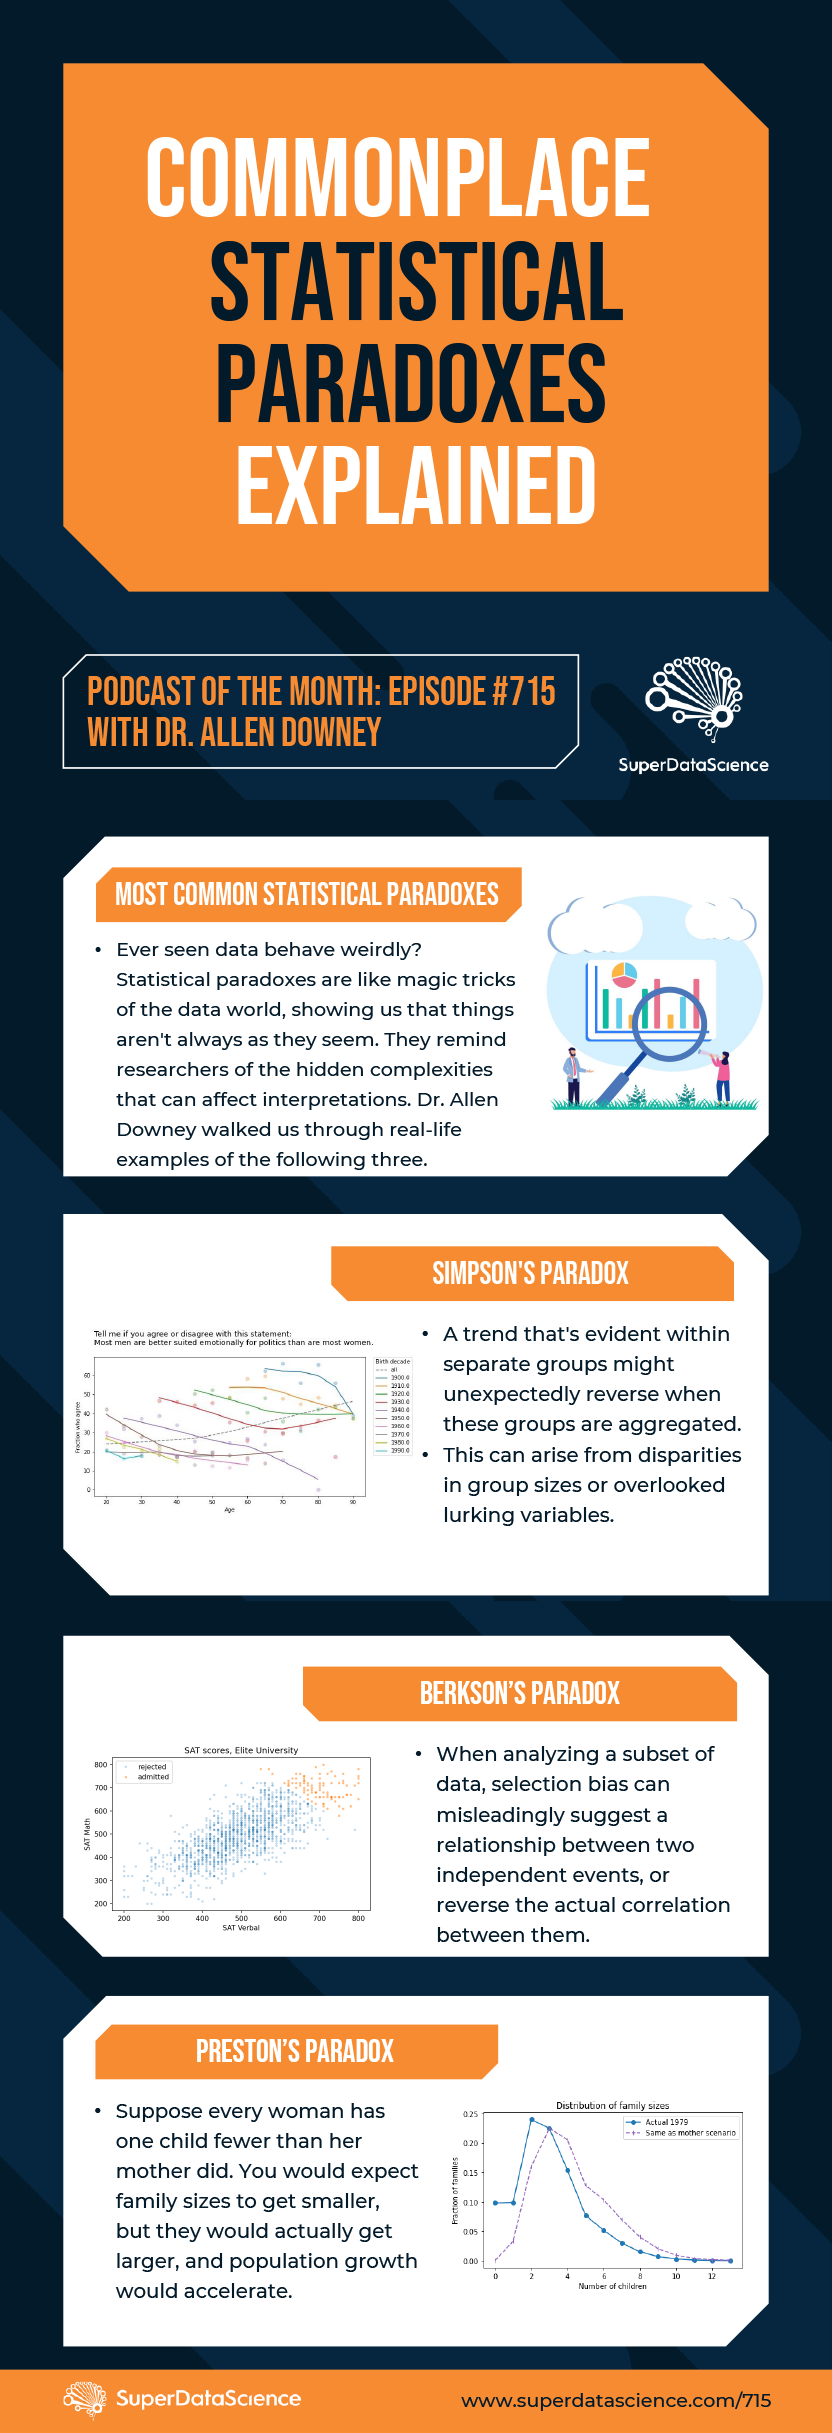
Today’s episode focuses largely on content from Allen’s upcoming book, his first book intended for a lay audience, and so this episode should appeal to anyone who’s keen to learn from an absolutely brilliant writer and speaker on how to use data to answer questions, avoid statistical traps and make better decisions. In this episode, Allen details underused techniques, like Survival Analysis, that can be uniquely powerful in lots of ordinary circumstances. He talks about how to better prepare for rare “Black Swan” events, how to wrap your head around commonplace paradoxes such as Preston’s Paradox, Berkson’s Paradox and Simpson’s Paradox, and he fills this in on what the Overton Window is and how our core beliefs shift relative to it over the course of our lifetime.
00:02:14
If you’d like a hard copy of any of Allen’s books, I have good news for you. I will personally ship 10 physical copies to people who, by Friday, September 22nd, share what they think of today’s episode on social media. To be eligible for this giveaway, please do this by commenting and/or re-sharing the LinkedIn post that I publish about Allen’s episode from my personal LinkedIn account on the day his episode’s released. I’ll pick the 10 book recipients based on the quality of their comment or post. All right, that’s it. You ready for this fascinating, practical and mind-expanding episode? Let’s go.
00:02:54
Allen, welcome to the Super Data Science podcast. It’s awesome to have you on the show. I’ve been aware of you for many years. I think we’re often both at ODSC and you’re always on a main stage somewhere drawing a lot of audience. You’re above the fold on all of the marketing materials. So yeah, it’s almost surreal to be here, able to have a conversation with you. Thank you for coming on. Where are you calling in from today?
Allen Downey: 00:03:23
Thanks very much. I am in Needham, just outside of Boston.
Jon Krohn: 00:03:27
Nice. So we’ve got tons to cover on the episode today, Allen, so let’s jump right into it. You have a book to be released in December called Probably Overthinking It: How to Use Data to Answer Questions, Avoid Statistical Traps, and Make Better Decisions. So first of all, I’d like to point out that you’ve done tons of books that have Think in the title. So people watching the YouTube version can even see the cover of your Think Bayes book hanging on the wall, presumably not actually a copy of the book in a picture frame. Yeah, so you have this Think series of books that you did with O’Reilly and now you have this book, Probably Overthinking It, that’s designed for a more general audience. So that’s interesting. Who is Probably Overthinking It out there, Allen?
Allen Downey: 00:04:15
Well, I suppose it’s referring to me. I’m making fun of myself for taking some of these ideas and deliberately going one step too far. I’ll explain it, and then, a little bit like an episode of MythBusters where they really have to blow something up at the end, I just want to take it one extra step and overthink it.
Jon Krohn: 00:04:36
Nice. So the book covers statistical traps that people run into with their thinking, and it highlights a lot of instances where people think that they’re using data to make better decisions, but in fact, they could be using the data to make worse decisions.
Allen Downey: 00:04:58
Yeah, and that was a balance that I tried to strike in the book, because a lot of the most interesting examples are like what you just said, where you can make mistakes, you can fool yourself, you can make bad decisions. But I really wanted the tone to be positive in the sense that we can use data to answer questions, and in most cases, it’s not super hard. The statistics we need are not complicated, but we do have to watch out for some of these tricks. And the tricks are really interesting, the different paradoxes that come up. They’re not really paradoxes. They’re places where the data is doing something unexpected, and the more examples of that that you’ve seen, the less likely you are to get fooled, to make bad decisions.
Jon Krohn: 00:05:51
Yeah, and so we have lots of these apparent paradoxes that we’ll cover in this episode. And yeah, it is interesting how you say that. Even as I was preparing for this episode, I was thinking about how these aren’t paradoxes. These aren’t philosophical paradoxes in the sense that it’s impossible to wrap your head around it and it doesn’t make any sense. It’s like, “Well, it does make sense.” I guess it seems paradoxical when you first notice this effect, or if you don’t, if you’re not aware of what’s going on there. Yeah, right from the beginning of the book, right from the introduction of Probably Overthinking It, you explain instances of why interpreting data is not always easy. Why is this the case? Why do people run into trouble?
Allen Downey: 00:06:37
Well, I think the biggest single idea is sampling bias: that before you have even started looking at your data, that data has come through a sampling process and you have left out some crucial part of it, or you have accidentally selected a part of it that’s now going to be misleading. And if you are aware of what that selection process is, first of all, you can evaluate whether that data is going to be adequate for your purpose, or sometimes you can correct for the bias if you know what that sampling process was, and you can model the bias. Sometimes you can invert it. Sometimes you can reverse that filter and make an unbiased estimate from biased data.
Jon Krohn: 00:07:28
So maybe the inspection paradox, Allen, builds on the phenomenon you’re describing there.
Allen Downey: 00:07:35
Yeah. I think that’s a perfect example. The more formal name for that is length-biased sampling, and that’s a case where whatever you’re observing, you are more likely to see the instances that are either long in space or long in time, and it’s a linear relationship, which is perfect, because that tells you exactly what the filtering process is doing, and it’s invertible. So one of the examples that’s in the book is the size of classes at a university. The Dean’s office might publish some data and they might say that the average class size is 25, but then you start talking to students and they’ll say, “All my classes are really big. I’ve been here for four years. The average class size that I’ve observed is more like 90, and they’re saying 25.” Who’s lying here? Who’s telling the truth?
00:08:29 And the answer in this case is actually both: that those averages are both correct, but they’re averaging over different things. The Dean is averaging over classes and the student experience is averaging over a seat in a class. So a class that has 300 students in it is going to get over-sampled by a factor of 300, and so that’s the reason for the difference. But now if you survey students, you know that you’re getting a biased sample, but you could take that sample and apply the inverse filter, and you can make an unbiased estimate of what the actual average is if you average over classes.
Jon Krohn: 00:09:13
Yeah, that’s a really cool example. I love that. Another example of these kinds of issues with data that we have been able to resolve and that you talk about in your book is you have this analysis of pregnancy durations, and this led to a clearer understanding of first babies’ timing. Is that related to the same biased sampling, or is it-
Allen Downey: 00:09:43
Right. No, I think that one’s a different phenomenon. That was one of the first examples that I worked on. I think that was one of the first articles that was in my blog and that eventually led to the book. And that one came about, like a lot of them, just in my life walking around and experiencing data. You have these questions that come up, and one of them is if you’re expecting a child, you’re going to hear, “Oh, first children are more likely to be born late,” but you’re also going to hear, “First children are more likely to be born early.” I was like, “All right, I’m going to settle this debate.” There’s a great data set from the National Survey of Family Growth, and that’s run by the CDC. It’s freely available data. So I downloaded it and started looking at duration of pregnancy in weeks. And if you just look at the averages, there is a small difference between the average duration for first babies and for subsequent babies.
00:10:48
And then digging into it more, I was looking at the expected remaining time, because when people ask this question, it’s often because they’re approaching their due date, and the due date is nominally 39 weeks. That is the most common duration, and when they make a prediction, if your doctor gives you a due date, it’s going to be based on 39 weeks. So sometime around 38 weeks, you might be asking, “What’s my expected remaining time?” And the answer, not surprisingly, is one week. But then if a week goes by, now it’s week 39. You’re on your due date and you ask again, “What’s my expected remaining time?”, it’s still about the same. The process sometime around 37 or 38 weeks, it becomes a memoryless process where it no longer matters what week you are in; the expected remaining time is constant. It gets down to about four days, but then it’s four days for about four weeks.
Jon Krohn: 00:11:53
Oh, interesting. That does seem paradoxical to me. Yeah, you would think… That is mind-bending to me. I can’t really wrap my head around that. It seems to me that if on average people are giving birth in week 39, that if you’re in week 39, you’d be able to say to somebody, “Well, now is about the time that you would be having it, and therefore, it’s just as likely to happen tomorrow as it is in four days.” But you’re saying it gets down to being about a week away or four days away. I can’t wrap my head around that.
Allen Downey: 00:12:33
Well, I think there are two ways to think about it, and one is mathematically or statistically. What you’re looking at, at that point, is an exponential distribution, and the exponential distribution has this memoryless property, which is if the expected time is four days and then four days elapse, in some sense you’ve reset the system. You’re back to four days. But from a mathematical point of view, it’s like, “Well, what’s going on there?” Another way to think about it is if an event has an equal probability of happening at any point in time, then it has this memoryless property, and it has this exponential distribution, and things like atomic decay have that, which is a given atom at least at a macro level, has a certain probability of decaying. And it does not matter how long that atom has existed; that probability seems to be unchanged.
00:13:39
The other example is like a soccer game, where roughly speaking, the probability of a goal during any minute of a game is pretty much constant. So the time between goals is exponential, and it doesn’t really matter how long it has been since the last goal. The next goal is equally far away.
Jon Krohn: 00:14:00
Right. Wow.
Allen Downey: 00:14:02
So then you can think about pregnancy and say, “Well, why does it behave like that?” And you can think there’s a maturation process, obviously, a developing fetus, and so up to the point where you’ve reached a level of maturity, the probability is low. But then after that, it’s constant, and maybe because there’s some process that’s random, that is like a trigger, that causes labor to begin, and it has this property of being nearly… [inaudible 00:14:39]. I mean, everything in the real world is only approximately mathematical.
Jon Krohn: 00:14:43
Right.
00:14:53
Tired of hearing about citizen data scientists? Fed up with enterprise salespeople peddling overpriced, mouse-driven data science tools? Have you ever wanted an application that lets you explore your data with code without having to switch environments from notebooks to IDEs? Want to use the cloud without having to become a Dev/Ops engineer? Now you can have it all with Zerve, the world’s first data-science development environment that was designed for coders to do visual, interactive data analysis and produce production-stable code. Start building in Zerve for free at zerve.ai. That’s Z-E-R-V-E dot A-I.
00:15:23
Wild. Very interesting, and I think I understand it now. It’s still a little weird to me. It still feels paradoxical. But jumping from the beginning of life to something that I think came about from the study of the end of life, survival analysis, you’ve called survival analysis vastly under-appreciated. Can you explain in layperson’s terms what survival analysis is and why it’s so crucial across various industries?
Allen Downey: 00:15:52
Sure. Well, the name comes from medicine, where most often you’re looking literally at the survival of a person. And that could be life expectancy, for example, where you are looking at the possibility that people might die at each age. In medicine, often you’re looking at someone with a particular medical condition and looking at survival rates as a function, usually time since diagnosis. But then in mechanical processes as well, you’re often looking at mechanical parts that wear out: electronic parts and so on.
00:16:29
So in that context of reliability engineering, we’re often interested in both mechanical wear, that things wear out over time, but also the possibility that you see the counterintuitive behavior. There’s the memoryless property that we were just talking about, and then under certain conditions you actually see the Used Better than New in Expectation property, UBNE, and that’s the opposite of what we expect. From mechanical things that wear out, you would rather have a new one than a used one. Would you rather have a new car or a used car? But there are not too many things in the physical world, but a number of things that have the opposite property: that the longer they’ve been alive, in some sense, they have demonstrated their longevity, and therefore, you expect them to live longer.
Jon Krohn: 00:17:26
Right.
Allen Downey: 00:17:27
One example of this that’s unfortunate is for many cancer diagnoses, they have the property that at the point of diagnosis, it is likely to be a severe condition, and so the life expectancy at diagnosis might be quite short, but after you have survived for a while, that implies first of all that it might be a less severe case, and second that the treatment might be working. And so someone who has survived, let’s say, one year after diagnosis might be substantially more likely to survive a second year. So cancer patients might have that property. People who are starting to ride a motorcycle for the first time might have this property. They are at the highest risk when they are new riders and less skilled. The longer they have survived, the more likely you expect.
00:18:24
And up until recently in human history, almost everyone ever born had this property at birth, because child mortality was so high up until quite recently that at birth your life expectancy might be 20 or 30 years on average, and that number is being pulled down quite a lot by mortality in the first year or first five years. If you survive the first two to five years, now you have the intuitive property that your life is getting shorter over time. But in the first year of life, up until very recently, it was the other way around. And that is still the case in places in the world that have high child mortality, but by and large, in middle- and high-income countries, now people have the conventional thing that we would rather be new than used.
Jon Krohn: 00:19:26
Yeah. I love all of these examples. This is so much fun. So I guess this survival analysis could be useful in practice in a lot of different situations that people aren’t thinking of. My startup is a SaaS company, and so survival analysis could be useful for us for modeling customer longevity. So there’s probably some property like this as well, where if we’ve already had a customer for quite a while, that probably says that they’re happy. If they’ve renewed their subscription for several years, they’re probably likely to renew again because they clearly get value from the product.
Allen Downey: 00:20:10
Yes. So I think churn analysis and related questions are… Survival analysis is a very useful tool, particularly because it solves a statistical problem that comes up all the time, which is: at any point in time you will have customers who have quit, and so you know when they signed up and when they left, and so you can compute that. And that’s analogous to if you’re treating a patient and someone has died, you know how long they lived. That’s contrasted with the people who are still alive. For them, you can put a lower bound on it. You know how long they have survived so far, but they’re still alive. Or you have a customer who is still with you.
00:20:59
I’ve also used this for analyzing marriage patterns. If you’re looking at people who are already married, then you know what age they were when they got married. If they’re not married yet, you don’t know what future age they might get married or if they won’t at all. And so you have this statistical problem of trying to combine those two groups: the ones where the duration is known, and the ones where you have a lower bound but you don’t know what the value will be in the future. If you naively combine those two groups, you are going to get a very misleading average. And what survival analysis is, is a set of statistical techniques for squeezing all of the information out of those two groups, both the known cases and the lower-bound cases.
Jon Krohn: 00:21:47
Awesome. That is such a concrete example. So we’ve talked about paradoxes already in the episode, including phenomena that for me are still a little bit paradoxical, mind-blowing in my mind in terms of this memoryless property, in childbirth in particular. But one of these paradoxes that is called a paradox but actually we can understand pretty well from the data is Preston’s Paradox. So how does the understanding of family-size distribution inform social change?
Allen Downey: 00:22:22
Yeah. This one was an interesting paper that I found. It was written by a demographer named Samuel Preston, and he pointed out a common pattern in looking at family sizes, which is if you ask women how many children they have, you will get one view of total fertility: the number of children a woman will bear in her lifetime. If you ask a child how big their family of origin is… There are a couple of different ways to ask that, but one is to ask, “How many children did your mother bear?” You are going to get a different view from those two questions. And maybe it’s a little bit obvious when you put it that way, but it’s an easy mistake to make. One way to see that you’re going to get a biased view is if you ask children how many children their mother bore, you will never hear the answer zero, so you are immediately overestimating fertility. And if someone comes from a family of two, they will be overrepresented by a factor of two, because in some sense, that family has two lottery tickets. They had two opportunities to appear in your sample, and someone from a family of ten has ten chances.
Jon Krohn: 00:23:51
Yeah. This sounds similar to the classroom example.
Allen Downey: 00:23:53
So it is definitely an example of length-biased sampling, and then once you’re aware of it, you can compensate for it in the same way. What Preston pointed out is that there is a surprising application of this in the context of demography and fertility, which is: suppose you imposed a rule. You are the dictator of a small island, and family sizes are so big, the population’s growing fast and you are worried that you can’t feed everybody. So you make a new rule. You say, “All right, every woman has to have one child fewer than her mother did,” and you impose this rule. And you come back 25 years later, and let’s assume that everybody adheres to the rule perfectly. Every woman has exactly one fewer child than her mother did. You would think that the family sizes would have to get smaller, because everybody’s family is smaller than their parents’ family, so the average has to get smaller.
Jon Krohn: 00:25:09
But I guess there’s something to do with the mothers had so many kids to begin with, that that number being so big, you have this exponential explosion, and this smaller birth rate is only cutting into that explosion a little bit.
Allen Downey: 00:25:29
You’ve got it. That is exactly what’s going on, that if you think again about a family with one child or two or zero… So someone who’s an only child will have zero children. If someone comes from a family of two, they’ll only have one child, but there are two of them. If someone comes from a family of ten, they will only have nine children, but there are ten of them.
Jon Krohn: 00:25:55
So this is 90 kids.
Allen Downey: 00:25:57
So there’s a fight going between the exponential factor that you mentioned and a linear shift, and any time you have a linear thing that’s fighting against an exponential thing, exponential wins every time, and in this case, the family size. In my example, what I did, I took the actual distribution from 1970 in the United States and I applied my imaginary rule. And if you do that, the family size goes from roughly 3 to, I think, 3.3, if I remember right. It goes up a little bit, and then the following generation, it would go up a little bit more. It actually keeps going up for 10 generations. It eventually comes down, but that’s a boundary effect, so it’s not maybe realistic.
00:26:50
But the example isn’t realistic. It’s not meant to be, but it actually reflects what was happening in the United States. Between 1970 and roughly now, total fertility has gone down from close to three to now close to two. And what that means is that each generation had fewer children than their parents did, not just by one, but actually by two and a little bit of change. So the average family size, in this particular sense of family size, went down by more than two.
Jon Krohn: 00:27:28
Right. Right, right, right, right. Yeah, that makes sense. That is an interesting paradox. But this one I was able to wrap my head around completely.
Allen Downey: 00:27:35
You got it. Nailed it.
Jon Krohn: 00:27:37
Nice. Yeah, sorry. You were about to say something.
Allen Downey: 00:27:42
Well, I was going to say that example… I made it into a toy example, partly because it’s easier to explain and quantify, but there’s another obvious example in recent world history: the one-child policy.
Jon Krohn: 00:27:58
Yes. That is immediately what I thought of. When you say something like constraining the number of children to some exact number, my very first gut reaction was like, “You could never do that,” and then my second one was like, “Hmm. It’s happened.”
Allen Downey: 00:28:11
It did, and there’s an interesting afterword to that, and I’m not sure how well this is known, but China has been relaxing the one-child policy gradually over the last decade. And what they found is that while the policy was in effect, the desired family size was declining consistently due to social factors and economic factors. So now that they have all but rescinded the policy, they’ve actually gone as far as encouraging fertility at this point, but it’s basically not working. The desired family size is now well below two. And at the time that I was writing the book, demographers were predicting that the population of China would start to decline. And in fact, I think within the last month, our best estimate is that that has happened.
Jon Krohn: 00:29:12
Deploying machine learning models into production doesn’t need to require hours of engineering effort or complex home-grown solutions. In fact, data scientists may now not need engineering help at all. With Modelbit, you deploy ML models into production with one line of code. Simply call modelbit.deploy() in your notebook and Modelbit will deploy your model, with all its dependencies, to production in as little as 10 seconds. Models can then be called as a REST endpoint in your product, or from your warehouse as a SQL function. Very cool. Try it for free today at modelbit.com. That’s M-O-D-E-L-B-I-T.com.
00:29:53
Yeah, that’s right. And it’s a little bit difficult to tell because there’s undocumented people because, for example, if you did have an extra kid and you weren’t allowed to, then you don’t report that officially. So we have to estimate. We can’t necessarily trust the stats. But yeah, it’s a fascinating phenomenon. And it’s interesting, this doesn’t really relate to anything in your book, I don’t think, but with that population decrease in a lot of other countries around the world, like Western Europe and United States, Canada, Australia, most Western countries, you offset that with immigration, but it doesn’t seem like there’s much appetite for that in China. There’s a desire to kind of be homogeneous to some extent. And that also meaning that because actually, there are quite a lot of cultures and languages spoken in China, but there’s this effort to kind of homogenize with education and language and try to have…
00:30:57
Yeah, it’s an interesting… It’s a conundrum that they’re facing. But this isn’t really a political show, so maybe I’ll just leave it there. I’ve got a quick nontechnical question for you before I get back to some more technical content from your book, which is just that you’ve written so many technical books in the past with code, with math. What motivated you to write a book for a general audience this time?
Allen Downey: 00:31:23
Well, partly my experience writing the blog, because I found I could write a range of articles, some of them are quite technical and others are not, and it really depended on what the topic was and what was necessary to convey the information. And that’s where I found very often was I could get the important ideas across and I didn’t need the math and increasingly I didn’t need the code. The key very often is data visualization, that if I have the right visual representation of the data, I can communicate really difficult ideas. And I think they come across clearly.
00:32:11
Part of that is the human visual system, just taking advantage of our innate ability to process visual information. So that raised the possibility. And then when I started to write, I wasn’t sure how much math there would be or code, but I just wanted to push and say, well, what do I need? And I really found I didn’t need any. I think there are two formulas in the whole book, no code at all, and a lot, I think 160 figures. So I was just leaning very heavily on data visualization and I really, it’s not that I cut out all the equations because I had to dumb it down or because the publisher was telling me to cut equations, just didn’t need them.
Jon Krohn: 00:32:59
Yeah, this makes a lot of sense to me. The only book that I’ve written is called Deep Learning Illustrated, and it’s a similar kind of thing. We tried to minimize… There is a lot of code in that book. It’s not a layperson’s book, it is for data scientists. But my experience of teaching deep learning to people was exactly what you said, that if I could come up with the right visualization, then it’s suddenly very easy for me to understand, very easy for me to explain, very easy for my students to understand. And then as a kind of interesting addition to that point is that the episode immediately previous to this one was with a blind guest on the show, Tim Albiges. And an interesting thing that comes up in our conversation, the way that I came across him initially is he had studied a lot of my content. He’d taken a number of my courses, and so he added me on LinkedIn and said he really appreciated the courses. And as we were talking, I was like, it’s interesting that you find my courses which rely so heavily on visuals and you’re blind. And even for him, those visuals well explained still allow him to understand a concept much better than without that visual at all.
Allen Downey: 00:34:26
Yeah. Well, there’s a part of that that makes sense to me, which is that the visual representation that you’ve drawn is your mental model. And now that you have written it down and you are looking at that picture and you are explaining it with that mental model as you are framing, I think you could understand the explanation without seeing the picture.
Jon Krohn: 00:34:48
Yeah, that’s the idea. It was just the most recent episode, so I don’t want to talk about it too much, but just so that you know, another really interesting thing that he does is, because he’s doing a PhD now in data science, and so if he comes across equations in text, sometimes it’s difficult to have that read out to you by a computer accurately. It’ll make mistakes in some circumstances. So with equations, figures, he can print them out enlarged on a special kind of thermal paper that then has the impression of the equation or of the image and he can feel it, which I thought was really cool.
Allen Downey: 00:35:32
Thinking about this book, I think that that would work well for the visualizations because most of them involved, they are mostly line graphs. You are mostly feeling a line on a page, and I think you could get the message from these graphs in that medium, because that was a challenge. I’ve done some accessibility work on materials that I’ve created, including writing alt text for images and with data visualizations, I’m always unsure what is the most valuable thing to do. My default is to write the message that I want a reader to get from that figure, but that’s different from describing the content of the figure so that the reader can interpret it.
Jon Krohn: 00:36:25
Maybe something to think about there with alt text and that kind of thing. But anyway, back to your book. So now we understand why you wrote it, and now I’ve got a whole bunch more questions that our brilliant researcher, Serg Masís, pulled out from the book. So I’ve got a whole section here now on questions related to normality and extremes. This is a big theme in your book. The opening chapter is called Are You Normal? Hint: no. So how do you feel about this common misunderstanding of quote, unquote “being normal”, especially in a society that values conformity? Maybe not as much as China, but there’s a question for you.
Allen Downey: 00:37:14
Right. Well, I think there are two chapters that are really on this theme, and as you said, one of them is about normality and the other is about extremes. The chapter about normality was one of the ones that surprised me, and probably the most enjoyable part of writing this book was when ideas would bubble up and surprise me. But this one comes from looking at measurements of human beings. It’s a dataset that was actually collected by the army. They have 93 different measurements of every part of your body, and I looked at one measurement at a time, and it behaves exactly as you would expect. Almost everything is well approximated by a Gaussian distribution, which has this property, which is that most people are in the middle and close to average, and a small number of people are at the extremes. And I think we have a strong intuition for what it means to be normal that is based on that Gaussian curve.
Jon Krohn: 00:38:18
Just for our listeners who aren’t aware of the Gaussian, it’s the bell curve. It’s this common curve that you see and you talk about college grades or whatever being fit to a curve. That bell curve, it’s the Gaussian curve. Anyway, sorry, I interrupted you.
Allen Downey: 00:38:34
Yeah, no, that’s a perfect example. In fact, I started with height, and height is one where most people are close to average. And so we think of that as being a normal height. And when we design things like cars and doorways and anything that depends on the proportions of a human body, we tend to focus on people who are close to average. And if you are very far from average, that’s both rare and “weird”. And I’m going to put quotation marks on “weird” and we’ll see why in a minute that if you are extremely tall or extremely short, that’s not, again, putting quotation marks on, “normal”. But it turns out that our intuition when we look at one measurement at a time, is totally wrong when we look at many, many measurements.
00:39:24
And this comes partly from research that was done by the Air Force in the 1950s, they were designing cockpits for airplanes and you need to fit in a cockpit in order to operate the plane as well as possible. And so they took 10 measurements and they wanted to find pilots who were close to average on all 10 of these measurements. So if someone was too tall or too short, they would exclude them and they would take the middle people and say, okay, well, now if your hips are too wide or too narrow, you’d be excluded. And at every step, every one of these 10 measurements, you would lose a few more people because they were too “weird” for a standard cockpit. And you probably see where the punchline is, which is nobody makes it through all 10 measurements. Everybody is “weird” in some way. And in fact, when you have 93 measurements, it’s even more extreme. And it turns out not only is everybody “weird”, but everybody is about the same amount of “weird.”
Jon Krohn: 00:40:30
Whoa.
Allen Downey: 00:40:30
I did that by looking, I would give you a point. For 93 measurements, you would get a point for every measurement where you are “weird”. And then I looked at what is the distribution of points? And out of 93, if I remember right, the most normal person was “weird” in 40 ways, and a typically “weird” person is like 60 out of 90, and the distribution is not very wide. The difference… If you are “weird” in 40 ways or you are “weird” in 60 ways, it doesn’t really matter. That is in my way of thinking about the same amount of “weird”, and by the time you get up into thousands of different ways that people vary, what you find is everybody’s about the same amount of “weird”.
Jon Krohn: 00:41:25
Super fascinating. I guess it’s something that I kind of intuitively thought about before, but I’ve never had these kinds of hard numbers around it. That 40 to 60 range is very far away from what I would’ve thought it would be. I would’ve thought it’d maybe 10 to 30 or something. So then what’s your “weird” threshold? Was that a standard deviation away from the mean?
Allen Downey: 00:41:46
For that one, yes. It depends very much on where you put the threshold, and it’s kind of arbitrary, so I don’t want to overstate the result, but there’s a mathematical view of this, which is in a multivariate distribution, most of the probability density is in a thin shell that is a distance away from the origin. And so that’s a mathematical way of saying that the density that’s right at the origin, like average in every possible way, is approaching zero. And if you go and search in this multidimensional space to find the people, you will find them all at roughly the same distance from the center.
Jon Krohn: 00:42:32
Nice. That’s a cool visualization. I like that. Awesome. All right, so that’s normalness as normal as can be. Let’s go to an extreme now with Black Swan events. So what is a Black Swan event and why is it essential to consider these kinds of events when planning for disasters?
Allen Downey: 00:42:57
Sure. So this chapter is about long-tailed distributions, and I borrowed the vocabulary. The Black Swan is a term that Nassim Taleb posited. He has a book that’s called Black Swans. The idea is that a Black Swan event, something that happens in the world is something that is unexpected, has a high impact, and it is particularly unexpected based on a model of past events. And so I think some of his original work was focused on financial markets where if you look at the return of a fund over time or changes in the stock market over time, you could look at past data, you could build a model that describes what has happened in the past, and then you could make a prediction of how likely is it, for example, that we will see a very large stock market crash or for that matter, an earthquake or some other kind of natural disaster.
00:44:01
And the original observation is if you use a simple model like the Gaussian distribution that we were just talking about, you will sometimes be catastrophically wrong because the actual tail of that distribution is much thicker and longer, it goes farther off to the right. And what that means is that very large rare events happen more often than we would think based on a Gaussian model. That’s the definition of a Black Swan. And I think the follow-up is, okay, so what can we do about that? And there are, I think, two parts of this, and one is sort of the easy part, which is to say, look, if you use a bad model, you will get bad predictions. That’s not surprising. And in many cases, you can do better simply by using a better model. There are mathematical descriptions of long-tailed distributions that you can use. The one I use in the book is a Student t-distribution. It’s very similar to Gaussian, but it has a long tail.
Jon Krohn: 00:45:10
Yeah. There’s some values of that where it is basically Gaussian. Is it if you get close to like one?
Allen Downey: 00:45:18
You got it.
Jon Krohn: 00:45:20
Needs to be value of one, then it is a Gaussian distribution or something?
Allen Downey: 00:45:21
That’s right, yes. There’s a third parameter that controls the thickness of the tail, and at one extreme it is just a Gaussian and at the other extreme, it is an absurdly long tail. I’ll tell you the example that I give to help people understand how absurd it is, which is it’s based on a Pareto distribution, different from the Student t, but it has the same kind of thick tail. And the question is, what would happen if you woke up in a long-tailed world where the distribution of height had the same 25th percentile as it does in our world, and it had the same 75th percentile, but the tail of that distribution was not Gaussian, it was long-tailed?
00:46:10
So you wake up in the world, the first few people that you meet would be of unsurprising height, but then maybe you’d go outside and you see 100 people and you see someone who’s about 6 foot 10. You think, oh, that’s that’s surprising. In only 100 people, that would be taller than expected. Out of 1,000 people, the tallest one would be about the height of a tree. And you’d think, okay, this is a different world. Out of the population of the United States, the tallest one would be taller than the distance from the Earth to the Moon. And in the world population, the tallest person would be taller than the distance from the Earth to Betelgeuse. So that’s how absurd these distributions are, and it’s why we really can’t get our brains around them. We are not equipped for dealing with that kind of world.
Jon Krohn: 00:47:17
This episode is brought to you by Grafbase. Grafbase is the easiest way to unify, extend and cache all your data sources via a single GraphQL API deployed to the edge closest to your web and mobile users. Grafbase also makes it effortless to turn OpenAPI or MongoDB sources into GraphQL APIs. Not only that but the Grafbase command-line interface lets you build locally, and when deployed, each Git branch automatically creates a preview deployment API for easy testing and collaboration. That sure sounds great to me. Check Grafbase out yourself by signing up for a free account at grafbase.com. That’s G-R-A-F-B-A-S-E.com.
00:48:01
That’s a really cool fact. And we should definitely make… We make YouTube shorts and TikToks and that should absolutely be one. I absolutely love that. That was such a great example of how if we didn’t have normal distributions for things like height, how wacky things would get. I love it. Awesome. All right, so another distribution for us to talk about, log-normal. So what’s the log-normal distribution and how does the log-normal distribution change our perception of outliers and extreme achievers? Is this… Yeah, we haven’t talked about the log-normal yet, even though we’ve talked about these extreme people as tall as the distance from the Earth to the mMoon and so on.
Allen Downey: 00:48:53
Great. The log-normal comes up in a number of places. And it’s a funny one because we’ve sort of talked about the two extremes. The Gaussian is extremely well-behaved in the sense of not having these outliers. The Student t and Pareto, they are almost incomprehensible. Log-normal is kind of in the middle. And it’s a funny one because we mentioned height, height is well modeled by a Gaussian distribution, but weight is not. If you look at someone’s adult weight or the distribution of adult weight, it is skewed to the right. So the very heaviest people are heavier than we would expect if the distribution were Gaussian, and there are a couple of ways to think about where that comes from, but one of them is a multiplicative growth model. It’s a little bit like interest rates. I’m drawing a blank on the term. Compound interest is what I’m groping for.
00:50:04
So it’s a little bit like compound interest where you start the year at a particular weight and maybe you gain 1% during the first year and then you gain 1% of your new weight the following year. If you gain 1% every year, you don’t grow linearly, you are growing exponentially. And if you have a group of people who are doing that over time, the distribution of their weights is going to start to spread out. There’s a rich-get-richer phenomenon. And unfortunately in this context, it’s a big people are getting bigger phenomenon. And the result of that is this log-normal distribution where the extremes are bigger than we expect.
00:50:54
It also comes up, I think as you mentioned, in the context of skills and abilities, that the things that you practice over your lifetime, you are getting better and better at them. And it’s more like you gain a few percentage points every year, not that you gain a constant amount every year. So this relates to Malcolm Gladwell’s book about outliers. He presented research that showed that world-class experts at almost anything have a lot of practice. That’s not too surprising. He quantified that with 10,000 hours. That’s a nice simplification. But the implication is the difference between a beginner and an expert is the result of all of those hours compounding on each other. And so the expert is much, much better. Not like a relatively short person compared to a relatively tall, but more than that.
Jon Krohn: 00:52:07
Right. Right, right, right. I totally get it. That was such a beautiful explanation. I get this log-normal idea. So I guess if we’re kind of imagining thickness of tails or how far these tails tend to reach out, Gaussian sits in the middle. Gaussian, the variance tends to be small.
Allen Downey: 00:52:38
Yes.
Jon Krohn: 00:52:38
And then the… What was the distribution we were talking about?
Allen Downey: 00:52:44
The log-normal is kind of the middle.
Jon Krohn: 00:52:46
Is the middle, yeah, exactly. And then what was the one we were talking about with the really tall people?
Allen Downey: 00:52:51
And then the really long ones like Student t and Pareto.
Jon Krohn: 00:52:54
Oh, yes, Student t and Pareto. That’s right, that’s right. So we’ve got Gaussian, log-normal, Pareto. Very cool analogies for explaining each of those. Nice. So then related to these perceptions of extremes, what is an Overton Window? And actually this is one that I don’t know. A lot of the stuff that we talk about on the show, sometimes I know the answer, and this is one that I don’t know the answer to. And I’m really excited to hear what it is because the only podcast that I listen to is a show called Last Week in AI, and it’s a news show, so it’s a weekly news show where they cover the last week’s AI news. Unlike this show, which assumes that our primary audience is technical, that one, they assume that actually… They do talk about open source tools and stuff. They’re not talking so much about getting into the nitty-gritty details of them, but more so about what this open source tool impact is going to have on society. And they frequently talk about the Overton Window in the context of artificial general intelligence coming about. And I hadn’t looked into it yet, so I don’t know if we’re going to figure that out right now, but-
Allen Downey: 00:54:15
Well, that’s interesting. Well, I’ll talk a little bit about the Overton Window and then maybe we can figure out the connection with AGI. Let’s see. So the term comes from political science and it describes the set of political ideas that are considered mainstream at any point in time, that if you are inside the window, your ideas are acceptable to the voting population. And if you’re at the edge of the window, you’re starting to be maybe acceptable or not. And then at the extremes, you are radical or extreme. The theory in the context of politics is that politicians are by and large good at figuring out where the Overton Window is and positing ideas that will be accepted. So that is one of the ways that politicians track public opinion. What I wrote about in the book is a thing that I’m calling the Overton Paradox, and I’m kind of making up that name, so we’ll see if it turns out to be like a name. But I just wanted to use it as a way to refer to this phenomenon. And there are a couple of parts to this, and I have to say it’s a little bit hard to explain without having the figures to show, but let me attempt it.
00:55:38
I looked at data from the General Social Survey and the design of the survey is really useful for tracking things like the Overton Window. How have public opinions changed over time? Because they started in the 1970s and every year or two they ask a representative sample of adults in the US a common core of questions. And many of them are about political views. So the first thing I wanted to look at is when we talk about conservative or liberal, what are we talking about? What are the questions that distinguish those groups?
00:56:22
So I picked the people who self-identify as conservative or liberal, and I found the 15 questions where they are most different from each other. And I won’t try to list them, but I bet you can guess what they are. It’s all of the topics that are topics of current political discussion. And then I wanted to see how that changes over time and how it changes with age. Now over time, it was not super surprising. By and large, most questions have been trending in the liberal direction for the last 50 years. So one of the examples is about homosexuality. Do you think that same sex sex is wrong? That’s not the exact wording of the question, but it’s something like that. And the fraction of people who think that that’s wrong has gone down steeply during the last 50 years, especially starting in 1990. So things have trended toward liberal.
00:57:24
At the same time, if you compare young people and old people, you will find that old people are more conservative than young people. That’s sort of what you’d expect. And if you look at the data, it is absolutely true. Now we come to the first question, which is what happens as people age? So if old people are more conservative, does that mean that young people will get more conservative over time as they get older? And let me ask what you think. Do you think that people get more conservative as they age?
Jon Krohn: 00:57:58
This is so interesting, and I’m so glad you asked because it’s the kind of thing that I think about this all the time. You’ve touched on so many topics in your book that are so fascinating to me. And yeah, this is one of the things that I think about a lot, and it ties into this thing that I think about people in general, and I guess it is this Overton Window idea, which is that there are some whatever genetic behavioral traits that we inherit, but most of our opinions about the world are things that we’ve learned. And over the course of our lifetime, we meet certain people that sway us one way or the other. We read a book or a blog post or whatever, and these things gradually shift our opinions. But on an individual basis that shift, you could, in some ways those kinds of questions you’re asking you could, and I guess that’s what we’re getting into, you could longitudinally ask somebody over their whole lifetime, and in some people there will be some shift. Maybe we’re going to find out that people do shift towards conservative a little bit or something like that.
00:59:08
But then what’s even more interesting to me is the idea of looking at how these things change, the distribution of these opinions over time, over a larger group. Because it seems to me like so many behavioral phenomena in the world are driven by this. Where are we going with politics? And that’s going to be determined if you were in 1990 or pre-1990 or 1950, it seems reasonable to me, or it seems obvious to me that if you are a conservative political party, you’re going to have more conservative views in 1950 than you do today. Because if you have the same views of the conservative party in 1950, you would be so far out of the Overton Window, no one would ever elect you. There’s people with those views, no doubt alive, but they’re not very likely to become a politician or to succeed as a politician.
01:00:09
It’s this interesting, so that question, openness to homosexuality, clearly that is something that has changed. I was born in 1985 and I have witnessed this dramatic change in perceptions in what you see on television and in news and on TV. Yeah, it’s been this dramatic change that I’ve been able to see over the decades that I’ve been alive. And yeah, it’s a perfect example of this, it gives us this way to project into the future to some extent as to what society will be like in the future because to some extent I suspect that these things will continue to move liberally. But yeah, back to your original question, I think that, I suspect that for most of the questions that you’ve looked at, for many of the questions that you’ve looked at, people probably do shift a little bit more conservatively. And I think it’s driven by things like, so maybe not the homosexuality one is a specific example, but so for example, when you are very young, when you’re a college student or high school student, you don’t have much of a stake in the system.
01:01:37
And so young people think capitalism is bad and we’ve got to change, it’s got to be something new. Bitcoin is the way or anarchy or whatever. But then you get a mortgage, you’ve got savings in a bank account, that stuff accumulates more and more over your lifetime, you’re bought into the system. This tends to happen as you get older. And so I think on some issues, this will mean that some people become more conservative. Maybe you’re less likely to maybe want high taxes in that kind of scenario, or you’re more likely to be against estate taxes. Whereas when you’re young, these seem like great things, let’s fund more education, let’s fund more social services, let’s have a more equitable world. Yeah. So I don’t know, I think that some of the questions, some people become more conservative over time because they tend to get more bought into the system.
01:02:39
But then, yeah, I think on maybe other kinds of questions like homosexuality, I actually think that that, I think people might continue to become more liberal on a question like that over time, because when, to go to an extreme, if you’re in a culture where it’s illegal to be homosexual, then there’s probably going to be, there’s going to be very little discussion of it except as maybe, oh, that’s bad, don’t talk about that. It’s bad. But then as things start to open up and you start to realize, Oh, society hasn’t imploded, and Oh, I work with so-and-so who’s homosexual and they’re great, and Oh, I had a kid that’s homosexual and that’s great, I love them too. So with those kinds of issues. So yeah, I guess, yeah, I’ve given you a very long complex answer, but I think for some issues people will become more conservative and other issues, they’ll become more liberal. And it’s based on these kinds of underlying factors that might generalize that I’ve identified.
Allen Downey: 01:03:51
Okay. Well, you hit the trifecta because what the chapter is about is age period cohort analysis, and you described an age effect, period effect and a cohort effect perfectly. So an age effect is something that happens to people over the course of their lives, sometimes for biological reasons and sometimes because of their stage of life. And you conjecture that people might become more conservative on economic issues because they are bought into the system, or they might become more liberal on social issues because their horizons broaden and they experience more things. Absolutely. Those could be age effects and those things are clearly happening. A period effect is something that causes an entire group of people to be influenced by something that is happening at a period of time. And it can be a single event like the terrorist attacks of September 11, or it can be something that is happening in the media. And so the changes in attitudes about homosexuality are a good example of a period effect. Basically all groups have become more tolerant during the same period since roughly 1990.
01:05:06
And you also mentioned the possibility of a cohort effect, which is depending on when you are born, your birth cohort is the group of people that you were born with, your generation or decade of birth, that is going to influence the experiences that you have growing up and the people around you and so on. So all three of those effects are happening. And in some sense it’s a race to see which ones are going faster or slower than the others. And that’s the foundation of the Overton Paradox, which is a race between the period effect, which I mentioned, which is that the average is tending toward liberal over time, and it’s happening within all groups, particularly you mentioned what does that distribution look like? If you split people up by liberal, moderate, and conservative all three groups are trending liberal at almost the same rate. It has spread out just a little bit. So that is a kind of polarization, but it’s not a very big effect.
01:06:09
But here’s the key thing. It has changed enough over time that if you look at these 15 questions that I selected, a conservative now is indistinguishable from a liberal in 1970. So if you took a time machine, you went back to 1970 and you selected an average liberal and you brought them to a Y2K party, happy New Year, it’s the year 2000. Compare them to their surroundings. They would be indistinguishable from a moderate in the year 2000. And if you brought them to 2023, they would be indistinguishable from a conservative in 2023. So they would be standing there in their tie dye and their peace medallion, and they would show up at the Republican National Convention and they would fit right in.
Jon Krohn: 01:07:15
That’s such a good visual. Oh, that’s great.
Allen Downey: 01:07:15
So that’s the time travel experiment.
Jon Krohn: 01:07:18
Yeah.
Allen Downey: 01:07:18
And now here’s the thing, that is exactly what happened to people who were born in the 1930s. In 1970, when they were first interviewed in the general social survey, they were on average about as liberal as the average 1970 liberal. And over the course of their lives, they gradually became slightly more liberal. And that’s almost every generation does the same thing. So all of those effects that you mentioned, they almost cancel out. By and large within each cohort people become a little bit more liberal over the course of their lives, but quite slowly, the age effect is very slow and the period effect is substantially faster. And the result is that someone who is liberal relative to the center of the road in 1970 will find themselves in the 2020s right of center. And if you ask them, are you liberal or are you conservative? People are more likely to say that they are conservative.
Jon Krohn: 01:08:35
Oh, really?
Allen Downey: 01:08:36
But they are more likely to be liberal over the course of their lives. And the reason is that the center of mass moves faster than most people. One way to think about this is you are being chased by the Overton Window, and most people will lose that race.
Jon Krohn: 01:08:59
Wow, wow, wow, wow.
Allen Downey: 01:09:01
Even if your views are unchanged over the course of your life, you will find yourself gradually more and more right of center because the center moves.
Jon Krohn: 01:09:10
Yeah, that’s really cool. I’ve really loved this whole discussion on this Overton window. This has been super, super interesting and it ties in, yeah, like I said, this is something that I think about a lot and one of the reasons why I think about it so much, and it ties in perfectly into that point that you just made about how the Overton Window is chasing us. The center is moving faster than we do. I don’t know, something, I meditate a fair bit. I have a daily meditation practice. Sometimes it’s just five minutes, but as often as I can, I try to do it for half an hour and actually sitting on the couch cushion and properly not being distracted for that half hour by outside events. And one of the things that comes to mind a lot in those states is how, and I think a lot of mindfulness practices are explicitly about bringing this about, are realizing that your thoughts are not you, that you are not your thoughts, your thoughts just pass through you.
01:10:15
And so this is interesting because in a lot of waking life, it’s in the meditation practice, I’m like, okay, I’m not my thoughts. But then as I go about my life, generally, it’s hard to shake that, I have this idea that I am a certain person and I have certain thoughts, I have particular political views that is me, but yet all of this thing that is me I know is going to change and it’s going to change as a result of how people change around me. People becoming much more liberal, young people… I’m 38, but I actually have quite a few friends that are in their early twenties, and there’s things that they do and perspectives that they have that are more liberal than the people that I grew up with and that I still hang out with today. But the more I’m around them, the more I’m going to have their kind of perspective, and because a lot of what they’re saying does make sense, they tend to be, they’re much more likely to be vegan.
01:11:22
And I’m like, well, it’s obvious that treating sentient beings, pigs are one of the most intelligent species on the planet, and we’ve got them locked up in small cages and they have these horrible existences and that’s bad. And yet I’m eating pork and I know that I probably shouldn’t be eating meat. And I’m like, oh, I hope that there will be great meat alternatives. I love meat alternatives. For whatever reason, because I was raised eating meat, I’m in this habit of continuing to do it and I make excuses for it. I’m like, well, I work out a lot. How am I going to gain muscle? I don’t know many other people who are able to gain muscle without eating meat. And so yeah, so I’m like, well, I’ll wait for meat alternatives, but meanwhile there’s this other part of me that’s like, well, maybe you’d have to be much more strategic about your protein sources and how you’re eating, but you could probably be vegan if you put more effort into it, and isn’t that worth the animal lives that you’d be saving?
01:12:17
So anyway, there’s these kinds of things that on any kind of given issue, they come about. So you’re just… Yeah, it’s interesting how you generally go around through your life with this sense that you are someone, but it’s all quite ethereal and it’s all changing. And yeah, with these kinds of population level distribution analysis, you can have a sense of who you’re going to be in the future or the probability of who you’re likely to become.
Allen Downey: 01:12:53
Yeah. Well, part of what you said is related to one of the earlier chapters, which is about the moral circle and moral progress. And it’s a possible answer to the question, if our beliefs on these 15 questions, or more broadly, political and social and economic beliefs trend toward liberal over time, is that just the most recent 50 years? Is it because of the dataset that I looked at or is that a bigger historical phenomenon?
Jon Krohn: 01:13:27
Yeah.
Allen Downey: 01:13:28
And there’s certainly evidence that it is a bigger phenomenon. People who have written about the moral circle include Peter Singer and Stephen Pinker. And the observation is that over time the sphere of moral rights that we extend gets bigger, that it historically might have been very narrow. It would be people like me. And then it comes to include people who are more and more dissimilar on all different axes, sexual, racial, political, just as it becomes more and more inclusive, we extend rights and respect toward more and more people and then at some point to animals as well. And it tends to be a ratchet effect that by and large, for example, once we have decided that slavery is morally unacceptable, it is very unlikely that we as a society will wake up sometime in the future and say, oh no, that was a terrible mistake. Actually, slavery is okay. We should resume that practice. It doesn’t tend to go that way. And in fact, it’s almost strange to look back at debates about whether slavery is okay or not.
01:15:01
That question is so far outside the Overton Window, it’s just bizarre to think that it was ever in the Overton Window. But at the same time that we can easily look back 50 years and find people who seem shockingly immoral by contemporary standards, we have to ask the question, what are we doing now? What are the things that we are currently debating that are going to seem incomprehensibly horrible in the not too distant future? And I suspect that the way that we treat farm animals is going to be high on that list.
Jon Krohn: 01:15:40
Absolutely. I think there’s no doubt in my mind that that’s the case. I think my grandchildren will be appalled that I was eating the flesh of a sentient being. And yeah, I genuinely, yeah, it’s one of these things it’s like… Yeah, anyway, we’ve already talked about it enough for a data science podcast, but it’s so obviously wrong to me already, and yet there’s this lag of habit and culture that means that I still am doing this thing that I know is morally wrong. Anyway yeah, actually that’s the most obvious one. It’ll be interesting to see some of the other ones. And yeah. So tying back to, it’s interesting, we did actually make really great progress through all of my questions for you up until now. Now we’ve really dug deep into this Overton one, but hopefully a lot of our listeners find it as fascinating as I think you and I clearly do.
01:16:40
And so let’s now tie that to the artificial general intelligence thing, which I actually, I think I have an idea for what they mean there. And it’s maybe easier for me because I’ve been listening to the co-hosts of last week in AI, Jeremy and Andre, talk about this Overton Window a number of times. So I think I have some sense, which is that maybe if you asked a general audience, it probably doesn’t make sense as a political question for your general for the 2024 US presidential election, but what people think about AGI might make sense in the data science community, certainly among AI researchers, it probably is the kind of question you could ask, you could you or me, what do you think the probability is of AGI being an existential risk event in the next five years or 10 years or 50 years? So I think that’s what they’re referring to, that there’s an Overton Window of what people expect, and then there’s people on, yeah, maybe extremes far outside that Overton Window that are relatively rare.
Allen Downey: 01:17:53
Yeah, I think I see the connection there. It’s an interesting one. I think I need to think more about it.
Jon Krohn: 01:18:00
Yeah. You know a lot more about the Overton Window than me. So it could be my naivete that allows me to take a well-established concept and say, and just use it, wield that hammer on various phenomena. Nice. Yes. So yeah, my final question on this Overton Window thing is, and I think you might have already answered it, but with a population aging in most of the developed world, what does that do to the Overton Window? And I think based on the discussion we’ve already had, I can probably speculate pretty well that it means things are going to continue to get more liberal.
Allen Downey: 01:18:36
They will possibly at a slightly slower rate because one of the things that drives that trend is the euphemistically named generational replacement, which is a nice way of saying that old people die and are replaced by young people. And if the young replacement is more liberal than the old person who died, that is one of the things that changes the average over time. And so in an aging population where that process is being stretched out a little bit, you have people who are living longer. And so in some sense, they are dragging the average down for a longer period of time and fewer people are being born. And so their contribution to the average is diluted a little bit. But I don’t think that that’s going to be a huge effect. That might slow things down a little bit. But I also think that there’s a countervening effect, which is I think that some of the period effects are getting stronger because of interconnectivity and the availability of information.
Jon Krohn: 01:19:41
Totally.
Allen Downey: 01:19:41
If you look at the question that we’ve been talking about, because I think it’s a nice example is acceptance of homosexuality. If you compare, let’s say a 10-year old me in 1977 to a 10-year old now, and think about what is their awareness of even just what homosexuality is, what the attitudes toward it are, they are infinitely more knowledgeable now than I was long before the internet existed. And I think that’s true of religion as well. One’s awareness of world religions is vastly different now and so on so many dimensions I think that availability not just of information, I don’t mean like reading Wikipedia, but the access to people that you can have conversed with people who are in different countries, different religions, different everything. That’s a very different world. And that’s going to drive period effects.
Jon Krohn: 01:20:44
For sure. And those friends of mine that are in their early twenties, they get a huge amount of their information and on culture from TikTok and Instagram reels and-
Allen Downey: 01:20:56
Which is global.
Jon Krohn: 01:20:57
… And yeah, which is global, and which exposes them very quickly to such a broad range of perspectives. Yeah. And I think there could be some good things that come out of social media use, I suppose, like people finding great podcasts like Super Data Science.
Allen Downey: 01:21:17
No, that’s right. And there is certainly accumulating evidence about the negative effects of social media. So I don’t mean to dismiss that. I think that that’s a serious thing, but I do think there are positive effects in terms of exposure to a much bigger world than pre-internet.
Jon Krohn: 01:21:38
For sure. And we could spend a whole bunch of time talking about that, but I want to squeeze in as many more of these amazing questions that we have for you. So all right, so we’re moving into this third section of questions that we have related to your book. So this is related to statistical fallacies. This is a fascinating section. So we’ve talked about AGI a bit now, but in the immediate term, we already have AI biases that are well-known to cause issues. There are examples of biases in AI having negative effects on people being able to get jobs that they deserve, or having really strict parole because of factors that correlate with being Black, for example, and are unrelated to the person’s actual behavior, or examples of teachers who are great teachers who have tons of awards, but some opaque algorithmic system has given them a low score and they’re let go.
01:22:37
And so yeah, there’s all these examples of these black box AI systems sometimes, which are for commercial reasons, kept under wraps in terms of what the exact underlying algorithm is. And then it’s, yeah, it turns out to be biased against, yeah, it could one, just do a bad job, be not much better than a coin flip, or even worse, be systematically negatively impactful against particular sociodemographic groups. And it’s worst. And it seems to be the most common case that when that does happen, it’s having that negative impact on groups that are already historically marginalized. So anyway, AI bias is clearly often the public discourse and you discuss it in chapter nine of your book. So related to that, what is the base rate fallacy and how does it play out in real world decisions, especially in sensitive areas like criminal justice?
Allen Downey: 01:23:38
Yeah. Well, I will say this was by far the hardest chapter to write. In many cases, what came out of the chapter felt like good news, and this one was more difficult in several ways. Let me start with the base rate fallacy, because the chapter started out easy. I used as one of the examples, a medical test like you go and take a COVID test and it comes back positive, and you want to know what’s the probability given that I get a positive test, that I have this condition. The base rate fallacy helps a lot with understanding how to interpret those results because it depends quite a lot on what the probability is that you have that disease before you take the test. So one way to think about that is to think about a screening test for a rare condition. So let’s say I go to my doctor and I do not have any symptoms at all, but he suggests a screening test, which means we’re just going to check to see if you might have this condition. If you get a positive test under those conditions, even if that test is very specific and very sensitive, it is still quite possible that that is a false positive because you started with such a low probability that you have the condition, and that’s very different than let’s say a COVID test.
01:25:07
You, you know that you were exposed and three days later you have a scratchy throat and the next day you feel awful and you have flu-like symptoms. I can tell you right now, you have a high probability of having COVID before you take the test. And if you then take the test and test positive, it’s a near sure thing. But to take it to the other extreme, one of the examples I used in the book, at least at the time that I was writing, in New Zealand the base rate was extremely low. And if you chose a random person and gave them a test, the probability was very low that they were positive. Remember no symptoms, they live in New Zealand, you have no reason to think that they have COVID. If you get a positive test, it is actually more likely to be a false positive than not. So those two extremes give you a sense of how you interpret a test in terms of its predictive value is very different depending on the base rate, where the base rate is the probability that you had that condition before you took the test. So that’s where the chapter started and that’s familiar territory. I think a lot of people who have studied statistics or machine learning have seen that example and it distinguishes between a property of the test like specificity and sensitivity and the predictive value under a particular condition.
01:26:38
And then you get to something like trying to predict who will commit a crime in the future. If you’re deciding whether to release someone on parole or release someone on bail, we are currently making those decisions every day. In some sense, there’s no way to avoid making those decisions. And they’re either going to be made by human beings or by algorithms or by some combination of the two, but it’s kind of inescapable. And the same factors that go into interpreting a medical test also go into interpreting the outcome of the algorithm. If an algorithm says that someone is high risk, that’s like a positive test on a medical test. And if it says low risk, that’s like a negative result. And so, how do we interpret it? So, that’s where the chapter starts.
01:27:36
And I reviewed COMPAS, which became famous in 2016. There was an article in ProPublica where they got data from a county in Florida and followed several thousand people over time to compare the predictions from the algorithm to the actual outcomes. Did this person get arrested again in the future or not? And they looked at exactly what you described, which is first of all, how predictive is it? And the answer is, it’s not great. So, a coin toss would be 50/50 correct and theirs was about 60% correct. So, on the one hand you could look at that and say, “Well, that’s not very good.” On the other hand you could say, “Well, it is contributing some information.” Someone with a high risk was about two times more likely to be arrested again in the future compared to someone who is categorized as low risk. So, that was a factor of two, and that is substantial if you are making decisions about whether it is safe for someone to return to society or not. That factor of two, that’s information. That is useful information. So, discarding it does not seem like the best idea.
01:29:03
And then the question is, “Okay, what do we do with it?” And it’s hard because one of the things that the ProPublica article found is that the effects on different groups were different. And in particular, they compared black and white defendants and found that the false positive rate was substantially higher for black defendants. Meaning that if in fact they were not going to go and commit another crime or be arrested again in the future, they were more likely to be wrongly flagged as high risk. And that seems like an obvious problem. And if you only read that one article, you would have a partial understanding of what’s going on, but in my opinion it would be incomplete.
01:29:52
There was another article published by the Washington Post that responded and basically said, “It’s more complicated than that.” Because they looked at the predictive value, which is to say, if the test says that you are high risk, what is the probability that you will commit a crime in the future? And they found that in fact, that was nearly identical for Black and white defendants. So, it seems like the algorithm was doing well by one metric and badly by a different metric. And that’s confusing and it takes some explaining to figure out what’s going on. But it turns out to be a difference in the base rate. That if you have two groups that have different base rates, you can have either equal predictive values or you can have equal false positive rates, but you can’t have both. And that’s true for an algorithm, but it’s also true for a human decision-maker. It doesn’t matter how you make the decisions, you are up against irrevocable mathematics.
Jon Krohn: 01:31:02
Wow.
Allen Downey: 01:31:05
So, that’s complicated. And then I did one more exploration to look at the differences between men and women and how this algorithm treated them and found that it is exactly the reverse of the situation when you look by racial groups. That for men and women, the false positive rates are nearly identical, but the predictive values are different. And what that means is that if you have a male and a female defendant, you give them the same risk score, the women are substantially less likely to be arrested again in the future. And that seems just as patently unfair as when the false positive rates are different. Because what it means is that you are effectively overestimating the risk for female defendants and therefore, they are more likely to be kept in prison or not released on bail, whatever the consequence of that decision is.
Jon Krohn: 01:32:06
Right.
Allen Downey: 01:32:07
So, when I said that this was a hard chapter to write, that’s what I mean. It is complicated and hard. I did my best to try to explain all of this and not to pretend that I know the answers, because I think if I can provide a service here it is by explaining what the problem is and maybe explaining that it’s a little bit more complicated than in the first iteration. And then, I think we have some hard decisions to make.
Jon Krohn: 01:32:37
That was fascinating. So, for our listeners out there, I guess first of all, they can check out chapter nine of Probably Overthinking It, to get even more detail on this deep fascinating issue with real meaningful social implications. And we’re talking about serious … How horrible to be held in prison wrongly, or if you’re unlikely to re-offend due to some algorithmic bias. I suspect that our listenership has a low probability … Generally, Data Science Podcast, we probably don’t have a very high probability of listeners being incarcerated. And so for our listeners, for our listener demographic, what are examples … And I think in chapter two, you covered some of these, in the chapter on relay races and revolving doors. What are some areas that people like our listeners might fall prey to bias samples and how can they protect themselves?
Allen Downey: 01:33:44
Yes. One of the examples that comes up is Berkson’s paradox, which is also known as collider bias. And that’s a case where I think, as you say, our listeners, depending on what their job is, might encounter this one. If you have a dataset that you’re looking at that has been selected from a particular population, you need to be careful about how that population was selected, because there can be correlations that appear in your sample that don’t exist in the world. Or the other way around, there can be a correlation in the world that you miss. And in fact, you can often flip the sign that in the real world there might be a positive correlation and in your sample it might be a negative correlation.
01:34:34
And particularly in the field of epidemiology, there has been an epidemic of Berkson’s Paradox. In looking at the literature, I found many papers where researchers seemed to be genuinely confused about what they were seeing. And it was often because of Berkson’s Paradox. I’ll give an example. I keep saying the name over and over, it would be good to explain what it is. One of the examples that I use is imagining that you go and you visit a college campus and suppose that you start asking people about their SAT scores. So, people have taken these standardized tests. Very often there are two parts, a mathematics part and a verbal part. And you might wonder how well they are correlated. And when I ask people who are highly educated, they’ve gone to highly selective schools, “Do you think that it’s correlated or anti-correlated? So, if someone is really good at math, does that mean that they’re also really good at verbal skills or do you think that they might be relatively deficient?”
Jon Krohn: 01:35:49
I have a hypothesis of what people would say.
Allen Downey: 01:35:52
Please.
Jon Krohn: 01:35:54
If you are in a top school, you probably had top scores on both, and the people around you probably had top scores on both. And so, you probably overestimate that people tend to correlate on those two.
Allen Downey: 01:36:09
That could be. Let me pose a version of that. Suppose it’s not an elite school, but what I call a second-tier school in the book, I call it Secontier College. So, suppose that at that college you will be admitted if your total score exceeds some threshold, but if you exceed it by a lot, then it’s probable that you are going to go somewhere else. You’re going to be admitted to an even better school.
Jon Krohn: 01:36:42
Right. Yeah, then in that school, you probably think that they’re very uncorrelated because you’re going to get all the people that had a very high score on one and not the other. Or, I guess you’d also have some people that did middling on both and the total score came out high enough. But certainly, you’d see a lot of examples of people who are very good on one of the tests or the other. Yeah.
Allen Downey: 01:37:08
Right. Right. And so, what I found by doing some modeling is on any given college campus, the correlation between those two scores could be positive or negative or close to zero. In a wide range, I think the most positive was 0.7, and the most negative was -0.3. So, the correlation that you see in that sample could be almost the entire range of possible correlations depending on what the college admission process is. It’s because of a selection bias. So, I think that’s a good example for getting your head around it. And now let me throw you the challenge, which is the low birth weight paradox. And this comes from the 1970s. A researcher in California was looking at the babies of mothers who smoked and wanted to see what the health consequences were. And he confirmed results that had been seen before, which is that if your mother smokes you are lighter on average at birth. You are more likely to be categorized as a low birth weight baby below a certain threshold, and your mortality rate is higher.
01:38:25
So, it seems like smoking is bad because it makes babies lighter and it increases mortality. And all of that was well known by the 1970s. None of that was surprising. But the next thing that he did was to focus on the low birth weight babies. And that made sense, that was the focus of the research. And he said, “Okay, let’s look at them and compare, if you are a low birth weight baby, is it better or worse if your mother smoked?” And it turned out to be better. And that was weird.
Jon Krohn: 01:38:59
Right.
Allen Downey: 01:39:01
And that is the low birth weight paradox, which is, if you are a low birth weight baby, it is better if your mother smoked. You are less likely to die, the mortality rates are lower. You are less likely to have birth defects, and so on. And so, he wrote an article in which he posited that although smoking might be somewhat detrimental on average, for low birth weight babies, it seems to be protective. It seems to have some beneficial effect. Now, how could that possibly be? Do you want to take a go at it or?
Jon Krohn: 01:39:39
Well, I suspect that like views over homosexuality, the views over smoking have also shifted quite a bit since that time. So, wow. I don’t know. I’m puzzled right now. I haven’t figured it out yet. It’s probably a sampling issue.
Allen Downey: 01:40:00
It is definitely, yes, it is a form of sampling bias.
Jon Krohn: 01:40:05
Oh, oh, oh, is it something to do with babies not making it at all?
Allen Downey: 01:40:19
That is an excellent guess. That would be survivorship bias and I don’t have a chapter on that one, but the sequel will definitely have survivorship bias.
Jon Krohn: 01:40:32
Something like if it’s a lightweight baby and the mother’s a heavy smoker, then maybe a lot of those babies just aren’t born.
Allen Downey: 01:40:42
That is an excellent guess, but I believe it is not the explanation in this case.
Jon Krohn: 01:40:46
Okay. Yeah. Go, hit me.
Allen Downey: 01:40:47
Well, I’ll give you the example that I think helps, which is what I call Berkson’s toaster.
Jon Krohn: 01:40:56
Okay.
Allen Downey: 01:40:56
Suppose that you’re at home and you smell smoke and a smoke alarm goes off and you go into the kitchen and you see that there’s burnt toast in the toaster. You would probably feel relieved.
Jon Krohn: 01:41:14
Right.
Allen Downey: 01:41:15
Because of all the things that could cause smoke and set off a smoke alarm, burnt toast is probably the most benign possible cause. So, you would see that burnt toast and you go, “Oh, thank goodness the house isn’t on fire.” That’s exactly what’s going on with the low birth weight babies. There are two things that might cause a baby to be born below this threshold, and one of them is maternal smoking, and the other one is everything else, including birth defects, including practically everything that could possibly go wrong. And it turns out that of those two possibilities, maternal smoking is the less bad one.
Jon Krohn: 01:41:56
I see.
Allen Downey: 01:41:57
Imagine you’re a doctor and you’ve been called in to consult because a baby has been born below this threshold, it’s a low birth weight baby, and you start asking questions and you find out that the mother is a smoker. You would say, “Oh, thank goodness.” Because that explains it, because the alternatives are worse. Once you find out that the mother is a smoker that makes it less likely that the low birth weight was caused by a birth defect or by anything else that’s worse.
Jon Krohn: 01:42:27
Right. That was a fascinating journey. Berkson’s toaster. I love it. That was such a clear example. It’s such a fascinating paradox. So, let’s squeeze one last paradox in if you have time, which is Simpson’s paradox.
Allen Downey: 01:42:51
Sure. Well, we actually-
Jon Krohn: 01:42:54
We covered that with [crosstalk 1:00:42:56].
Allen Downey: 01:42:56
… we sneakily talked a little bit about that with the Overton Window because that’s an example where in each group, if you divide people up by their birth cohort, they generally become more liberal over time. And you can focus on particular questions, if you look at things that pertain to racism and sexism and homosexuality, as we’ve talked about, people tend toward more liberal, over time, within each group. But now when you put all the groups together, it tends toward more conservative … And sorry, by age, I misspoke a little bit there. The key part of this example is that we have to look at people by age. And so, this is an example where all of the groups are going in one direction and then when you put them together, the aggregated average goes in the opposite direction. So, that’s Simpson’s paradox.
Jon Krohn: 01:43:54
Yeah, I think our discussion earlier of the Overton Window should make that clear. Yeah, it’s a very interesting effect. It’s one that’s very easily visualized. It’s the kind of thing that I’m sure you have a few visualizations in your book that make it crystal clear instantly. When you see the chart, it’s this no-brainer ability to understand this apparent paradox.
Allen Downey: 01:44:18
Yeah, the visualizations help a lot. And in fact, the conclusion is, the resolution of the paradox is that there is no paradox. This is something that can happen in a dataset and there’s just no reason to expect otherwise.
Jon Krohn: 01:44:37
Yeah, exactly.
Allen Downey: 01:44:39
One of my examples is looking at penguins, and if you look at a particular species of penguin, there is a correlation between the weight of the individual penguins and the lengths of their beaks. And it makes perfect sense because a bigger penguin probably has a bigger beak. So, if you look within any given species, you see the positive correlation that you expect. But it turns out that if you take a whole bunch of different penguin species and you lump them all together, because the different species have both different weights and different beak sizes, they end up in these clusters that are in different parts of the plane. And if you draw a line between the clusters, it happens to have a negative slope. And the resolution of that paradox is like the old joke where you go to the doctor and you say, “Doctor, it hurts when I do this.” And the doctor says, “Well, don’t do that.” That is Simpson’s paradox. It’s, “Doctor, when I take a whole bunch of disparate groups and I put them together and I compute aggregate statistics, I get confusing, meaningless results.” And the doctor says, “So, don’t do that.”
Jon Krohn: 01:45:57
Nice. Well, I got through half of the questions that I wanted to go over with you. We had tons more content prepared on … You had actually another book come out earlier this year. So, you had a technical book called Modeling and Simulation at Python: An Introduction for Scientists and Engineers. We had some questions prepared for you on that, that I think were pretty interesting. And then we had questions going back to your whole think series from O’Reilly. So, Think Python, Think Data Structures, Think Stats, Think Bayes, but we’ll just keep those for the future.
01:46:38
We also had stuff on career changes and future plans, because in addition to being an accomplished book author, you taught at Olin College and Harvard University for almost 19 years, but now you’re doing stuff in industry, so there’s potentially interesting things there. But I’ll put a pin in those questions and we’ll just wait until you have another book come out and we’ll get you on the show again hopefully, if that sounds interesting to you. And then, hopefully, maybe your next book will be less interesting than this one and so we’ll be able to get past our questions just from the new release, and we’ll get into some of that other content.
Allen Downey: 01:47:21
I’ll work on making the next book as uninteresting as possible.
Jon Krohn: 01:47:25
Perfect. So yeah, it’s been so awesome having you on the show. This has been an awesome episode for me. I don’t think I’ve been quizzed like you’ve been quizzing me and I found it really fun. It’s been nice to be trying to stretch my brain and maybe getting in the right direction on some of the puzzles. All right.
Allen Downey: 01:47:48
It’s a habit. As a teacher, I have to be Socratic.
Jon Krohn: 01:47:52
Yeah. Yeah. Yeah. Well, I enjoyed it a lot. So, maybe our listeners even out there, it’d be a good idea, I should have said this with the first one, not at the end, but they could pause at that moment when you pose the questions and try to come up with their own answers. So yeah, fantastic. Before I let my guests go, I do always ask them for a book recommendation other than one of their own. Do you have any for us?
Allen Downey: 01:48:18
I might, since it came up, we talked about the moral circle and I mentioned Steven Pinker’s book, The Better Angels of Our Nature, and that is a somewhat older one, he has a couple of more recent ones, but I think it holds up well. And in fact, one of my figures in this book is an updated version of a figure from that book. So, I think that topic in particular, the expansion of the moral circle and more general, I think the moral progress, is a really important message. Speaking of statistical bias, I think one of the things that we face is negativity bias in the media, which is the great majority of what we consume is bad news because it’s a better story. It’s what people are biased to listen to, and it’s what the media are biased to deliver. And I think we miss a lot of the really good stuff that’s happening. I think take a look at Our World in Data to see some of the very large scale trends in the world that are by and large, very positive. And I think the book Factfulness is another good one to get a little bit of an antidote to the pervasive media diet of negativity.
Jon Krohn: 01:49:34
Yeah. Absolutely. And I hope you’re preaching to the choir with our audience here. You certainly are to me. Before I ever started hosting this show, it was something that I would blog about from time to time, it was just like, “Why is everyone so negative when all these great things are happening?” And for me personally, part of the antidote is I get most of my news through The Economist, which yes, it does cover the tough political stories, but by and large over time … I think a stat that I read in there recently, and accumulation of dollars is maybe not the best indicator of livelihood, but in the last 20 years, so something like from 2020 to 2023, the amount of wealth on the planet has gone from something … It’s gone up by a factor of five, and there’s just constantly, the quality of life is being improved for people on the planet. There are absolutely issues that we need to deal with, climate change, maybe existential risk from artificial general intelligence and nuclear war.
01:50:51
But yeah, by and large things are getting better all the time and it’s too bad that, yeah, the media … I mean, it’s totally understandable that the media has this bias towards negative events because as you say, that’s what our eyeballs want. So, that gets them more advertising revenue. But then the second big thing is that this show itself, this is almost all good news and sometimes we have tougher issues, we even touched on some tougher things in today’s episode, but by and large, the careers that our listeners have picked and that we talk about on the show, it’s unbelievable the exponential opportunities for us and for our listeners in this field and the things that are happening are so extraordinary.
01:51:36
Yeah. So, hopefully that’s part of the antidote. And yeah, it’s my dream to someday be able to have … Just as you’ve gone now from your technical books to your more general book, I hope to be able to create more and more content that has this positive exponential growth message for everyone. So, we’ll see what happens there. Anyway, very last question. I’m sure lots of our listeners have absolutely loved hearing your insights from your book today and tangential insights. I’ve certainly absolutely loved it. How can people follow you for your thoughts after the episode?
Allen Downey: 01:52:22
Sure. I think the best way to find me is my blog, which is also called Probably Overthinking It. So, I think if you can remember those three words, you can find me. The things that I’m putting on the blog now are the things that will probably find their way into a sequel to this book. And from there, you can also find me on social media. There’s one particular platform that is imploding at the moment, but is still one of the places that I sometimes have good conversations with people about data science. It is the social media platform that dare not speak its name. But I’m also available on Mastodon. And as I mentioned, again, Probably Overthinking It is the name of the blog.
Jon Krohn: 01:53:07
Nice. Well, thank you so much. Yeah. Truly an amazing episode. And yeah, I really do hope that we will have a number two.
Allen Downey: 01:53:17
Would love to. I think there are so many things we could keep talking about.
Jon Krohn: 01:53:25
Wow-whee! What a guest, what an episode. I personally was riveted to Dr. Downey’s clear, example-packed manner of speaking throughout. I hope you were too. In today’s episode, Allen filled us in on how length-biased sampling in his university classroom example, for example, leads to misestimates of how many students there are in a class on average, but that the sampling error can be corrected. He talked about how exponential effects always win out over linear effects, as in his hypothetical example of family size being forced to shrink over time and how this explains Preston’s paradox.
01:53:59
He filled us in on how Black Swan events are better modeled by students’ t-distribution than the more common Gaussian bell-shaped curve. He talked about how politicians posit ideas within the Overton Window because they’re likely to be accepted by most people, but how this window shifts over the course of our lifetime due to age, cohort, and period effects. And he talked about how Berkson’s paradox explains why low birth weight babies with mothers who smoke are observed to be heavier, even though smoking actually stunts birth weight.
01:54:27
As always, you can get all the show notes including the transcript for this episode, the video recording, any materials mentioned on the show, the URLs for Allen’s blog and social media profiles, as well as my own at www.superdatascience.com/715. Beyond social media another way we can interact is coming up on November 8th when I’ll be hosting a virtual half-day conference on building commercially successful LLM applications. It’ll be interactive, practical, and it’ll feature some of the most influential people in the large natural language model space as speakers. It’ll be live in the O’Reilly platform, which many employers and universities provide access to. Otherwise, you can grab a free 30-day trial of O’Reilly using our special code SDSPOD23. We’ve got a link to that code ready for you in the show notes.
01:55:12
Thanks to my colleagues at Nebula for supporting me while I create content like this Super Data Science episode for you. And thanks, of course, to Ivana, Mario, Natalie, Serg, Sylvia, Zara, and Kirill, on the Super Data Science team for producing another amazing episode for us today. You can support this show by checking out our sponsors’ links, by sharing, by reviewing, by subscribing, but most of all, just keep on tuning in. Until next time, my friend, keep on rocking it out there and I’m looking forward to enjoying another round of the Super Data Science Podcast with you very soon.